





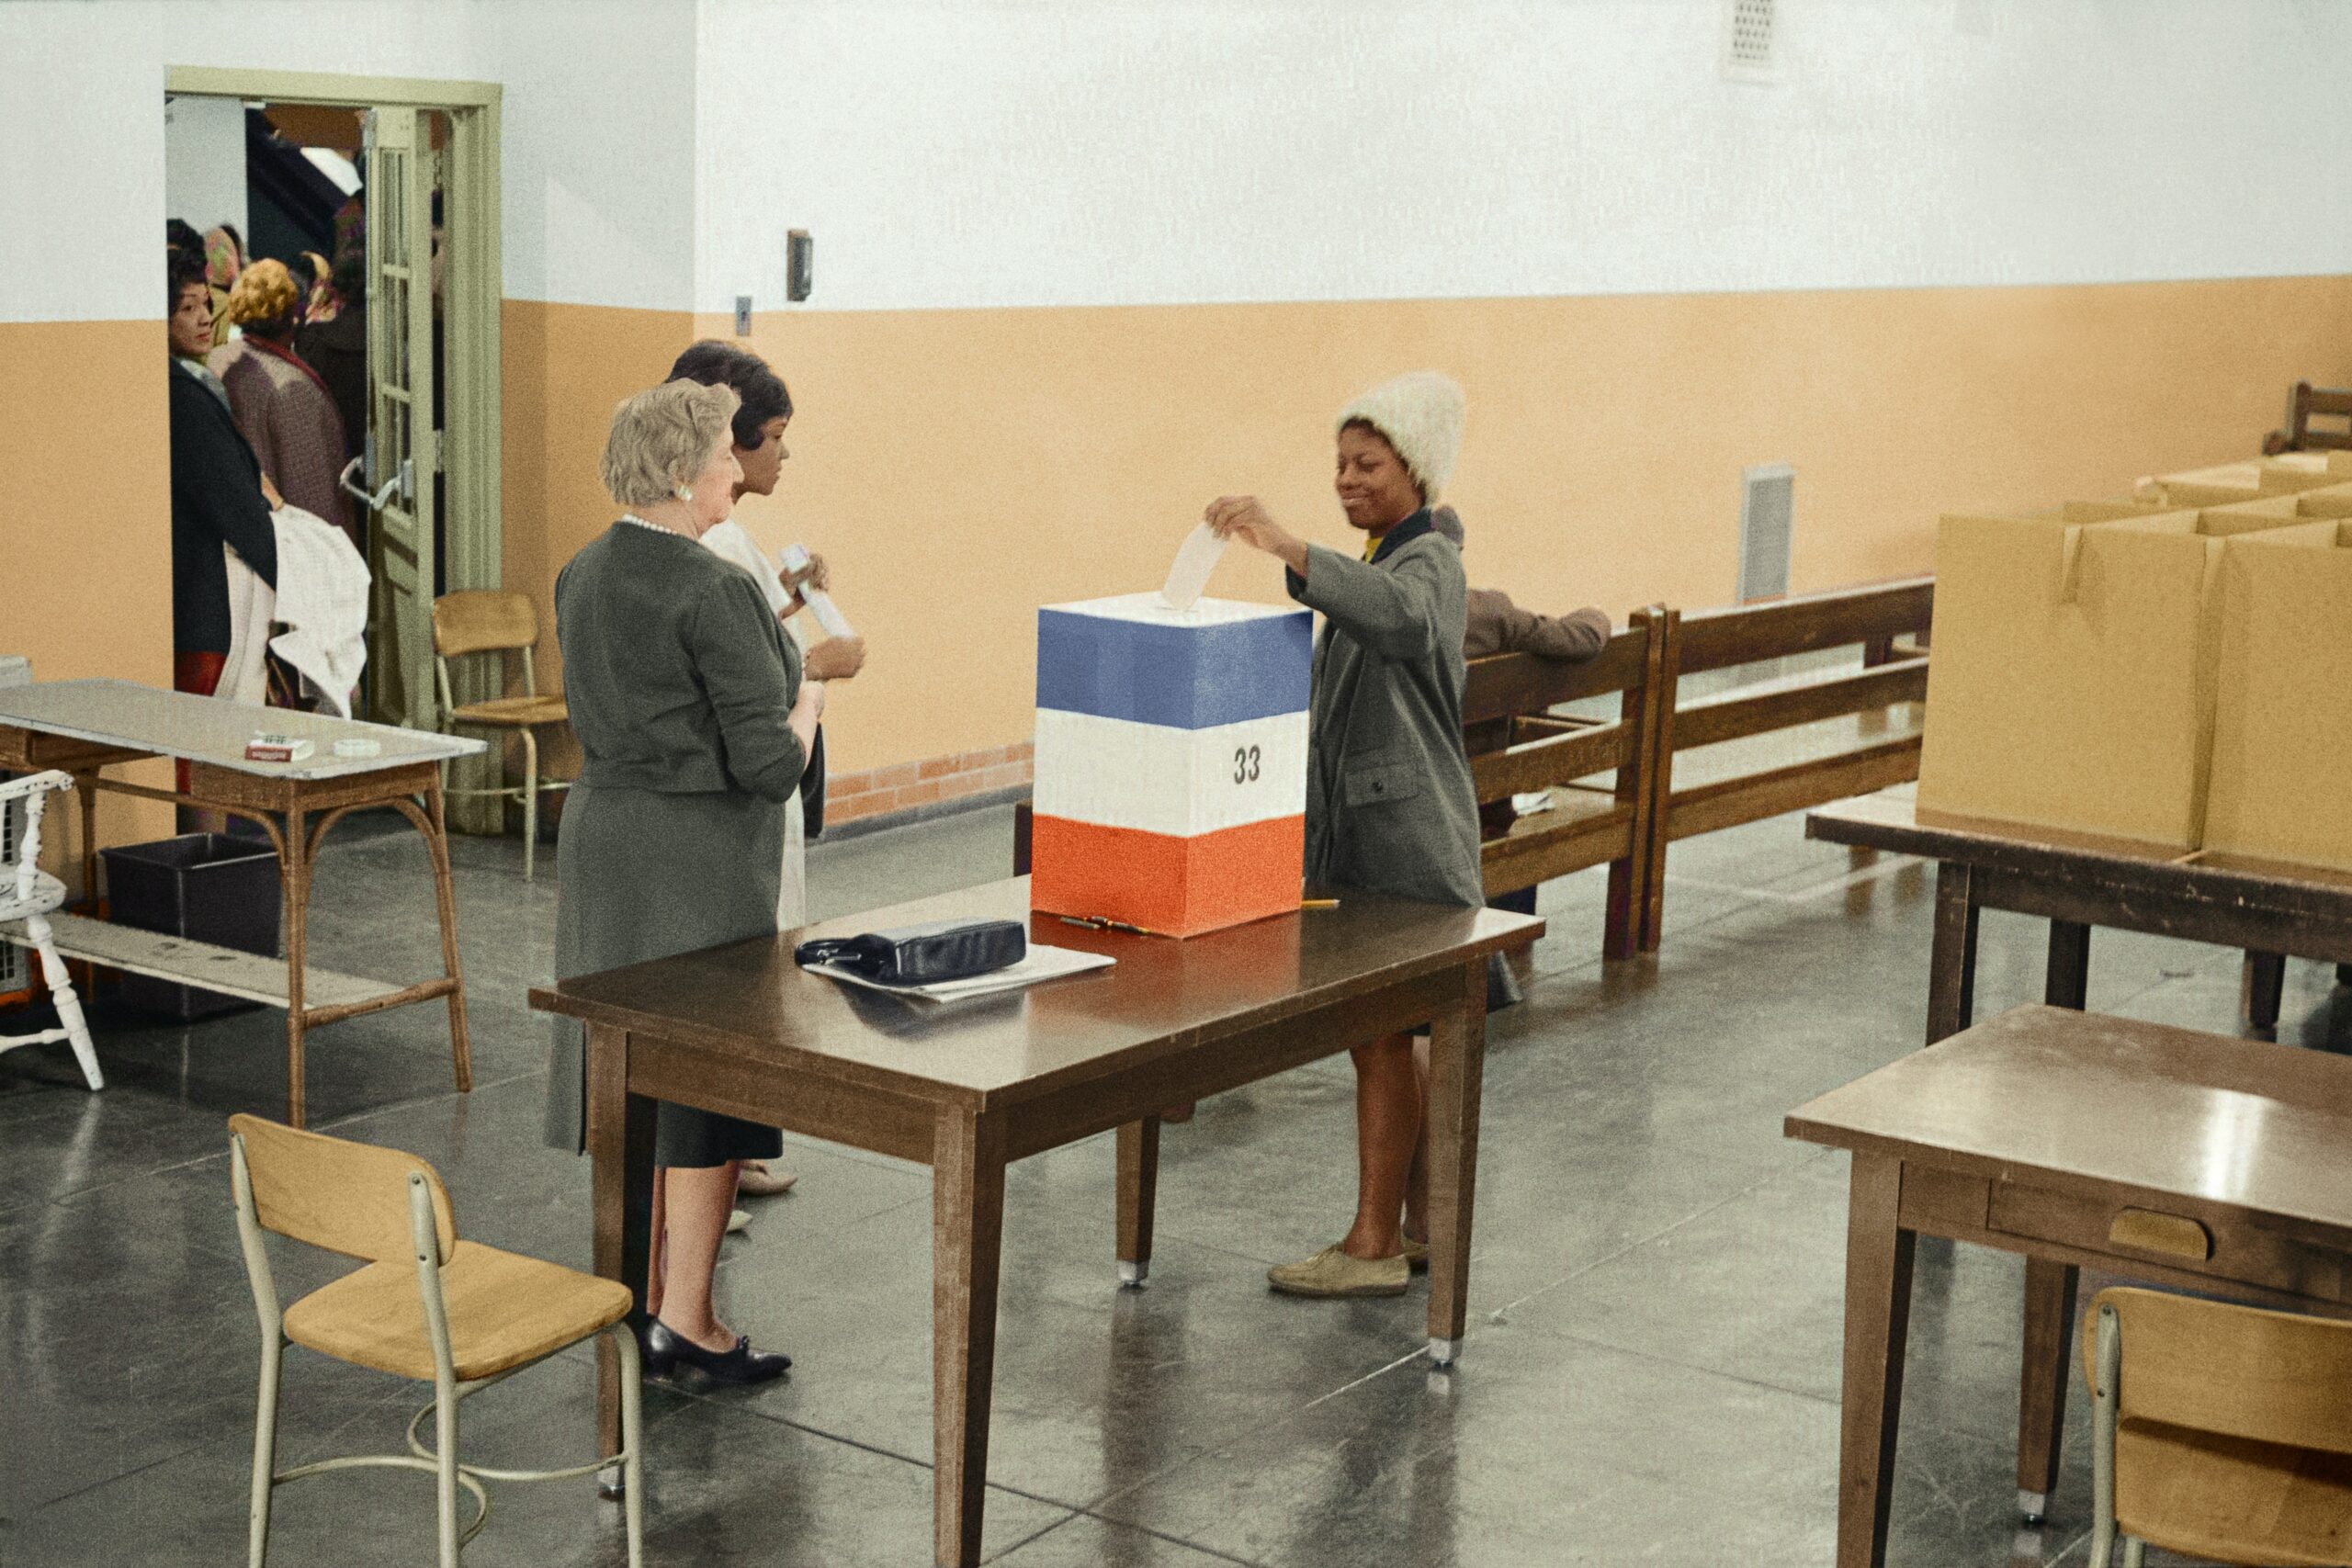
This blog post examines the link between ethnicity and voter turnout, a critical issue in our diverse societies. We draw on recent research to understand this complex relationship.
Studies show ethnic minorities, especially in Europe, often vote less than majority groups. Bhatti and Hansen’s research in Denmark found that non-Western immigrants’ voting is influenced by the number of voters from the same ethnicity in their area. More co-ethnic voters locally can increase voting rates. But this varies across different ethnic groups and situations, showing a multifaceted set of factors at play.
The consequences are significant. Lower turnout in some ethnic groups can lead to their underrepresentation in politics, possibly worsening social and economic inequalities. We’ll explore how neighborhood demographics, local candidates, and electoral systems affect ethnic minorities’ voting behaviors.
Our exploration will address these questions:
- How does ethnic minority concentration in neighborhoods affect their political engagement and voting?
- What role do local candidates from the same ethnic background play in encouraging these voters?
- How do various electoral systems influence voting patterns across different ethnic groups?
Our goal is to clearly understand ethnicity’s role in voter turnout, using the latest data and studies. Join us in uncovering this vital aspect of democracy.
Historical Context
Ethnic Voting Patterns Over Time
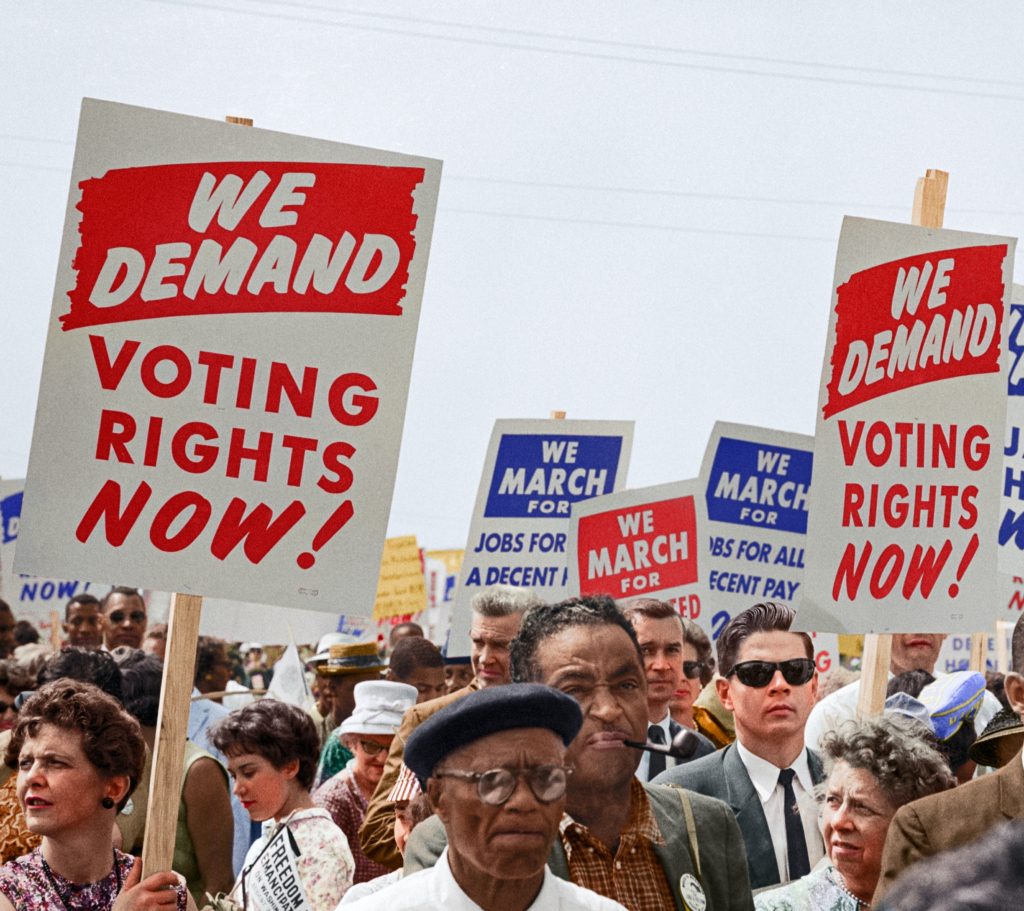
Ethnic voting patterns have changed significantly over time, influenced by social movements, laws, and public opinion shifts. In the U.S., African American voter turnout has varied greatly. After an initial surge during the Reconstruction era, voter suppression under Jim Crow laws led to a decline. The Voting Rights Act of 1965 marked a significant increase in African American voter turnout.
In Europe, post-World War II immigration introduced new ethnic minorities into the electorate. Their voting behavior has evolved, reflecting their societal integration and relevant political issues.
Key Historical Events and Voter Turnout
Major historical events have significantly influenced ethnic voter turnout. The civil rights movement in the U.S., for example, greatly increased political participation among African Americans. Martin Luther King Jr.’s words, “Our lives begin to end the day we become silent about things that matter,” encapsulate the movement’s impact on political engagement.
Worldwide suffrage movements also reshaped the electoral landscape. The 19th Amendment in the U.S., giving women the vote, and similar laws worldwide brought new groups into the electorate, affecting election outcomes.
Changes in immigration policies have further shaped voting demographics. The U.S. Immigration and Nationality Act of 1965, for example, diversified the electorate by ending national origin quotas, leading to an increase in immigrants from Asia and Latin America.
Publicly Available Data and References
The U.S. Census Bureau’s data on voter turnout by race and ethnicity provides insights into these trends. Their reports show how voter turnout varies among ethnic groups, reflecting current social and political dynamics.
Factors Influencing Voter Turnout
Voter turnout is shaped by a blend of socioeconomic, political, environmental, and demographic factors. This comprehensive overview integrates findings from various studies to highlight these diverse influences.
Socioeconomic Factors
Income and Education: Income levels and education are pivotal in determining voter turnout. Lower-income individuals often encounter barriers to voting, while higher education correlates with increased voting rates. The Pew Research Center’s analysis of the 2016 U.S. presidential election underscores this, showing higher participation among higher-income voters.
Political Factors
Party Affiliation: Strong party identification is a significant motivator for voting. David Campbell, in “Why We Vote,” identifies party affiliation as a crucial predictor of voting behavior.
Candidate Representation: Candidates who resonate with specific demographics or ideologies can significantly boost voter turnout. The election of Barack Obama, for instance, led to a substantial increase in African American voter turnout.
Environmental Factors
Weather Conditions
- United States: Research like “The Republicans Should Pray for Rain” by Gomez, Hansford, and Krause demonstrates that bad weather, especially rain and snow, reduces voter turnout in the U.S.
- Sweden: In contrast, Gimpel’s study on Swedish elections found that rainfall does not significantly affect voter turnout, indicating the importance of local contexts.
Climate
- France: “Climate and Electoral Turnout in France” by Ben Lakhdar and Dubois observed that rain decreases voter turnout, while sunny conditions increase it.
- Italy: “Voter Turnout and City Performance” by Prete and Revelli shows that voter turnout rates can influence city performance, particularly in environmental and administrative areas.
Demographic Factors
Ethnicity and Race: Ethnicity and race are significant determinants of voter turnout. Studies have shown varying turnout rates among different ethnic and racial groups, often influenced by factors like candidate representation and socioeconomic status.
Age: Younger voters typically have lower turnout rates compared to older demographics. This can be attributed to factors like political engagement levels, life stage, and perceived relevance of the electoral process.
Gender: Gender can also play a role in voting behavior, with some studies indicating variations in turnout and political preferences between men and women.
Quotes and Data Points:
- “Rainfall decreases voter participation by nearly 1% per inch” – Gomez, Hansford, and Krause.
- “Higher-income voters were more likely to participate in the election” – Pew Research Center.
- “Party identification is one of the most reliable predictors of voter turnout” – David Campbell.
Ethnicity and Voter Turnout: An In-depth Analysis
African American Communities
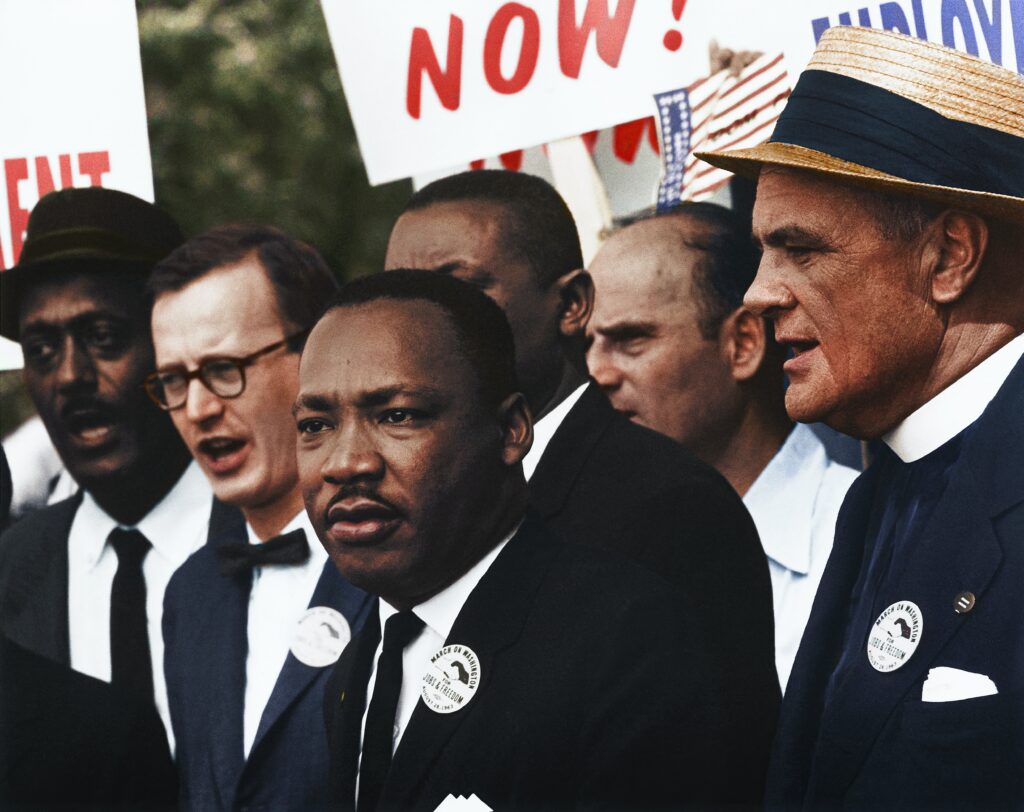
Historical Struggles: African Americans have faced significant voting barriers from slavery through the civil rights movement. These challenges spurred efforts to secure voting rights and increase political involvement. Martin Luther King Jr. emphasized the importance of this right, stating, “The denial of this sacred right is a tragic betrayal of the highest mandates of our democratic tradition.”
Recent Trends: Recently, African American voter turnout has improved. Actions against voter suppression, better voter education, and stronger political representation have raised participation. Influential African American leaders and relevant issues have also motivated voters. The Pew Research Center notes a notable rise in African American voter turnout in the 2020 U.S. presidential election.
Hispanic/Latino Communities
Growing Influence: The U.S. Hispanic/Latino population is rapidly increasing, gaining political significance. This has led to more efforts in voter mobilization, focusing on registration and education. These initiatives have resulted in higher election turnout.
Challenges: Hispanic/Latino voters face challenges like language barriers and limited information access. Addressing these requires specific outreach and education. The NALEO Educational Fund is key in enhancing Latino civic participation.
Asian American Communities
Diversity: The Asian American community is diverse, leading to varied political participation. Some groups are highly active, while others face language and cultural barriers. Recognizing this diversity is essential for increasing engagement.
Mobilization Efforts: There’s a growing push to mobilize Asian American voters. Efforts include increasing voter registration, providing language support, and considering cultural differences, aiming to strengthen their political representation.
Native American Communities
Historical Disenfranchisement: Native Americans have historically faced voting challenges, including restrictive policies and limited polling access. Current initiatives are addressing these issues to enhance political participation.
Current Initiatives: Efforts to improve Native American voter turnout involve collaborations between tribal governments, advocacy groups, and policymakers. These focus on overcoming barriers, expanding registration access, and enhancing civic education to ensure fair representation.
Voter Suppression and Ethnicity
Historical Instances
Ethnic communities have long faced voter suppression. In the United States, African American voters were systematically disenfranchised during the Jim Crow era through literacy tests and poll taxes. Historian Carol Anderson describes these tactics in “One Person, No Vote,” stating, “These tests were not about assessing literacy, but about disenfranchising African Americans.”
Contemporary Challenges
Today, ethnic minorities still encounter voter suppression. Current methods include strict voter ID laws, voter roll purging, gerrymandering, and limited polling places. A notable case is the 2013 Shelby County v. Holder decision in the U.S., which led to the closure of over 1,600 polling places, mostly in minority-heavy areas, as highlighted by the Leadership Conference on Civil and Human Rights.
Globally, ethnic minorities face similar challenges, ranging from complex registration processes to intimidation. The United Nations emphasizes the need for equal voting rights and combating electoral discrimination.
These ongoing issues highlight the continuous fight for fair and equal voting access for all ethnic groups. It’s not just about removing barriers but ensuring every citizen’s right to vote is respected and protected.
Ethnicity, Representation, and Voter Turnout
Role of Ethnic Representatives
Ethnic representatives are vital in boosting voter engagement. They empower ethnic communities by representing their identities and interests. Barack Obama’s words, “We are the ones we’ve been waiting for. We are the change that we seek,” capture this essence. These representatives act as advocates and motivators for their communities.
Impact on Voter Engagement
Representation directly affects voter engagement in ethnic communities. According to the Pew Research Center, people vote more when they feel represented. On the other hand, feeling unrepresented can lead to less voting. More ethnic diversity in political offices can balance this and encourage more people to vote.
Combating Voter Suppression
Addressing past and present voter suppression is crucial for a fair democracy. The ACLU points out ongoing efforts against tactics that unfairly target ethnic minorities. Fighting these practices and promoting diversity in representation can lead to better voter turnout and more inclusive decision-making.
Theoretical Viewpoint
Anne Phillips, in “The Politics of Presence,” discusses “descriptive representation.” This concept suggests that having diverse representatives makes political institutions more legitimate and responsive. This idea supports that ethnic representation can increase voter turnout by making politics more inclusive.
Case Studies
2008 Presidential Election
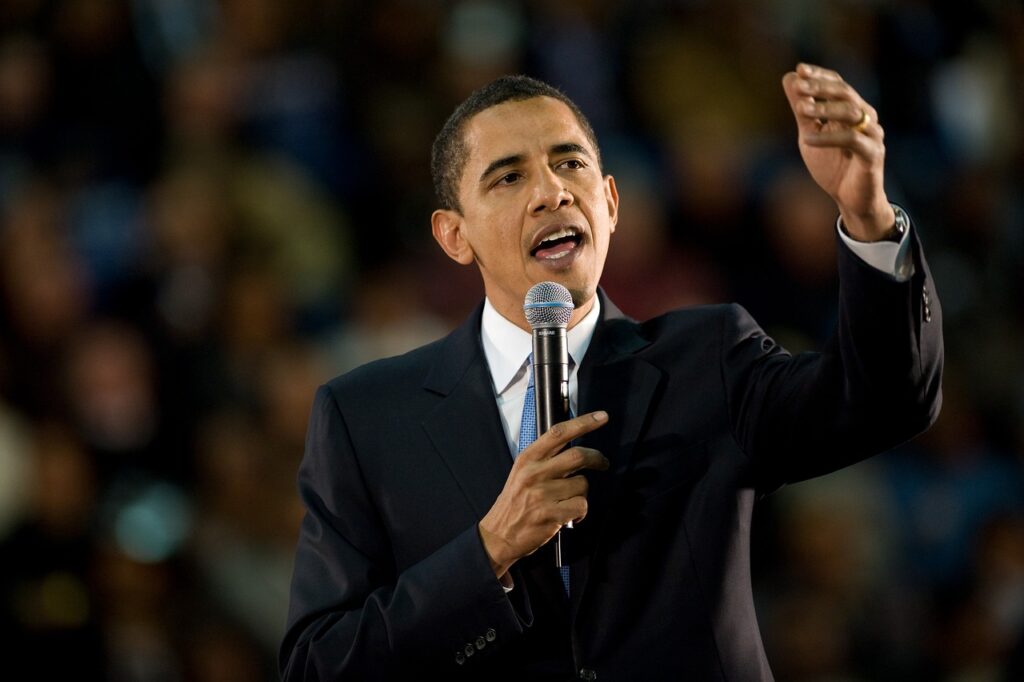
The 2008 U.S. Presidential Election marked a significant moment in ethnic voter turnout. Barack Obama’s candidacy, as the first African-American major-party nominee, greatly boosted African-American voter engagement. African-American turnout reached a record 65%, up from 60% in 2004. Obama’s campaign, representing a potential shift in racial dynamics in U.S. politics, strongly motivated African-American voters. Political scientist Michael Dawson observed, “Obama’s candidacy changed the political landscape, drawing African-American voters to the polls in unprecedented numbers.”
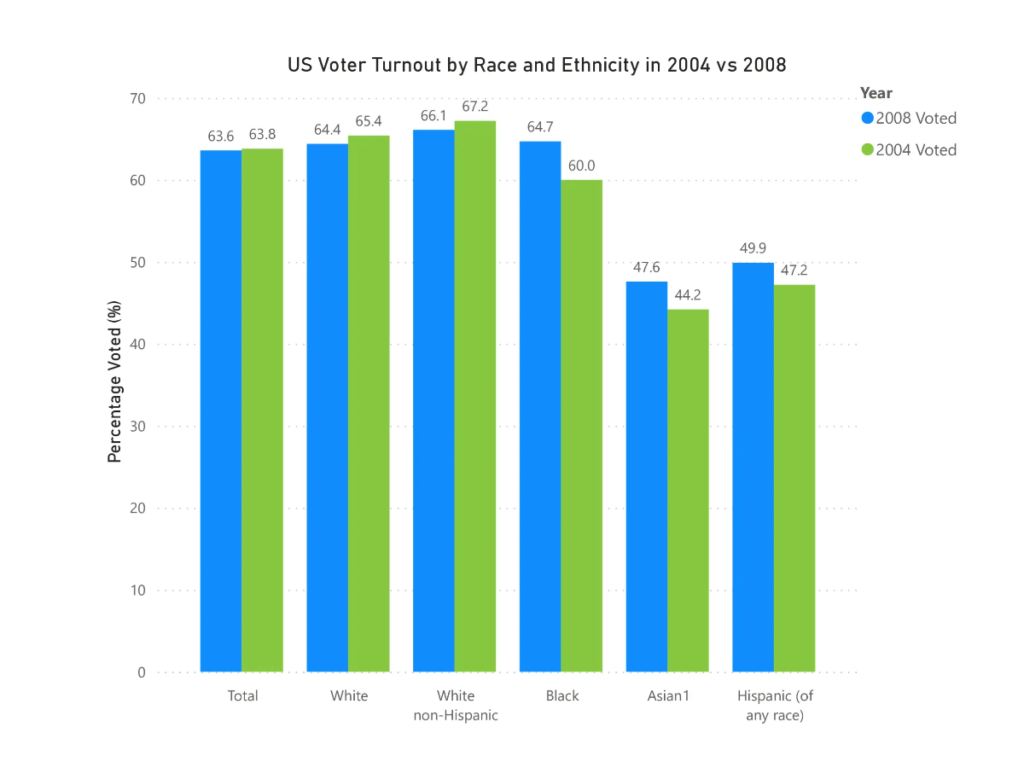
Source: U.S. Census Bureau, Current Population Survey, November 1980-2020
2018 Midterm Elections
The 2018 Midterm Elections showed a notable increase in ethnic minority voter participation. Latino turnout, for example, increased to 40.4% from 27% in 2014. This rise was partly due to increased political awareness and mobilization by groups like the Justice Democrats. Alexandria Ocasio-Cortez’s (AOC) emergence, advocating for diverse communities, significantly contributed to this trend. Her success as a young Latina in politics inspired many in the Hispanic community to vote.
Local Elections
Local elections, particularly in cities with large ethnic minority populations, reveal how ethnicity influences voter turnout. In cities like Atlanta and Houston, mayoral and city council elections have shown higher participation from African-American and Latino communities. These elections often focus on issues directly impacting these communities, such as police reform or immigration policies. The effectiveness of grassroots campaigns, addressing specific community needs, highlights the value of targeted, culturally sensitive political strategies.
These case studies demonstrate the relationship between ethnicity and voter turnout. They emphasize the role of representation, community-relevant issues, and focused mobilization in encouraging ethnic minority voter engagement. Bernard Fraga, in “The Turnout Gap,” notes that candidates who resonate with and understand ethnic communities can significantly affect voter turnout.
Strategies to Improve Ethnic Voter Turnout
Improving ethnic voter turnout is essential for a truly representative democracy. Here are streamlined strategies, supported by research and real-world examples, to increase election participation among ethnic communities.
Voter Education Programs
These programs are crucial in helping ethnic communities overcome challenges like limited knowledge of voting procedures and language barriers. They provide vital information on voter registration and rights. An example is the U.S. Election Assistance Commission, which offers voting resources in various languages, aiding diverse communities.
Outreach and Mobilization
Effective outreach involves voter campaigns, community events, and partnerships with local organizations. These efforts help with voter registration and language assistance. A notable example is the NAACP’s efforts in the U.S., which have significantly increased African American voter turnout.
Policy Reforms
Policies that expand early voting, offer multilingual materials, and ensure accessible polling locations are vital. Canada’s Elections Act, for instance, provides multilingual voting information, enhancing accessibility for diverse groups.
Real-World Examples and Data:
- New Zealand’s Maori Representation: New Zealand has Maori electoral rolls and constituencies, boosting Maori election participation.
- South Korea’s Multilingual Support: South Korea provides election information in multiple languages, accommodating its ethnically diverse population.
Technology and Ethnic Voter Turnout
Online Voter Registration
Online voter registration is key to making voting more accessible for ethnic communities. Reports show that it’s cost-effective and accurate. Multilingual options and simpler registration steps help overcome barriers that often stop ethnic minorities from voting. For example, California’s system, supporting multiple languages, significantly increased diverse community registrations. This method is convenient and tackles common logistical issues, likely boosting ethnic group voter registration.
Social Media Campaigns
Social media is vital for engaging ethnic voters. During the 2020 U.S. Presidential Election, campaigns like #VoteReady and #Election2020 informed millions about registration and polling. They encouraged discussions and participation in ethnic communities. The Knight Foundation found that social media especially influences younger, diverse voters.
The Role of Cultural Identity
Cultural Barriers
Overcoming cultural barriers is essential for higher ethnic voter turnout. Addressing language issues, cultural norms, and political system unfamiliarity is key. Culturally sensitive outreach, language help, and civic education are effective. “Voto Latino,” for instance, offers bilingual resources, aiding Hispanic voters in the U.S.
Cultural Celebrations and Voting
Incorporating voting into cultural events can boost turnout. Voter registration and education at cultural festivals or events create a familiar, engaging atmosphere. This approach builds community pride and links cultural identity with voting. “Souls to the Polls,” for example, encourages African American churchgoers to vote, combining cultural and religious traditions with voting.
Ethical Considerations in Ethnic Voter Turnout
Ethical Campaigning
Ethical campaigning is crucial for fair elections. Candidates and parties must avoid misinformation and divisive tactics that harm ethnic voter turnout. Barack Obama’s 2008 campaign is a prime example. With its positive and inclusive approach, it significantly increased voter turnout across ethnic groups in the U.S. Obama’s message, “We are not as divided as our politics suggests… We are one people; we are one nation”, underscores the impact of ethical campaigning.
Media Representation
The media plays a vital role in influencing voter behavior. Ethical media representation means covering candidates from all ethnic backgrounds fairly. A Pew Research Center study shows that media representation affects public perception and voter behavior. Media should avoid stereotypes, promote inclusivity, and provide accurate information, which is essential for informed voting decisions and increasing voter turnout.
International Perspectives
Comparative Analysis
Comparing different countries and electoral systems helps us understand ethnic voter turnout. This analysis reveals the best practices and lessons from various contexts, deepening our understanding of this complex issue.
Global Efforts to Promote Ethnic Voter Turnout
Ethnic voter turnout is a worldwide issue. International groups, governments, and NGOs work together to encourage inclusive voting. The United Nations’ Sustainable Development Goal 16 focuses on inclusive decision-making. Similarly, the European Union supports initiatives to boost political participation among ethnic minorities. These efforts aim to promote democracy and fair representation for all ethnic groups.
The Future of Ethnic Voter Turnout: Trends and Challenges
Emerging Trends
Ethnic voter turnout is evolving with new technologies and demographic shifts. Mobile voting and targeted digital campaigns are increasingly important for engaging ethnic voters. The Pew Research Center highlights social media’s growing role in politics, suggesting these methods could effectively mobilize ethnic voters.
In the U.S., ethnic diversity is reshaping the electorate. The Census Bureau projects that by 2045, no ethnic group will be a majority, emphasizing the need to engage ethnic minorities in voting.
Anticipated Challenges
Challenges like voter suppression, language barriers, and systemic inequalities continue to affect ethnic minorities. The ACLU reports on issues like stricter voter ID laws and reduced polling locations. Overcoming these barriers requires policy reforms and community initiatives, such as multilingual voter education. Engaging young voters is also key, as the Harvard Youth Poll shows their increasing political activism.
Looking Ahead
The future of ethnic voter turnout depends on using technology, adapting to demographic changes, and addressing systemic challenges. The rise in ethnic minority voting in the 2020 U.S. elections demonstrates the potential of these efforts.
Key Findings
In our article “The Impact of Ethnicity on Voter Turnout: Unraveling the Complexities,” we’ve explored how ethnicity affects voter turnout. We found that ethnic minorities in Europe often vote less than majority groups, influenced by factors like the presence of voters from the same ethnicity in their area. This leads to significant issues, such as political underrepresentation and increased social and economic inequalities.
We’ve traced the changes in ethnic voting patterns over time, influenced by social movements, laws, and public opinion, with examples from the U.S. and Europe. We’ve looked at factors affecting voter turnout, including socioeconomic status, political affiliation, environment, age, and gender.
Our focus also included the challenges faced by ethnic groups in the U.S., like African Americans, Hispanic/Latinos, Asian Americans, and Native Americans, discussing their historical voting struggles and recent trends. We’ve tackled the issue of voter suppression, its history, and current forms, and highlighted the importance of ethnic representation in boosting voter turnout.
Additionally, we’ve suggested strategies to improve ethnic voter turnout, emphasizing voter education, outreach, policy reforms, and the use of technology like online voter registration and social media. We’ve also discussed how cultural identity affects voting behavior and the importance of ethical practices in campaigning and media representation.
FAQs (Frequently Asked Questions)
What is Voter Turnout?
Voter turnout measures the percentage of eligible voters who cast ballots in an election. It indicates public engagement in politics and reflects the health of a democracy. High turnout suggests an active electorate, while low turnout can signal apathy or dissatisfaction with available political choices.
Several factors influence turnout, such as the election’s importance, race competitiveness, voting ease, including early or mail-in options, voter education, public sentiment, and weather on election day. Voter turnout varies significantly across countries and regions, influenced by these factors and legal frameworks. For instance, some countries enforce compulsory voting, penalizing eligible citizens who don’t vote.
Why is Ethnicity an essential factor in Voter Turnout?
Ethnicity significantly impacts voter turnout through three key aspects. First, it shapes political identity. Ethnic backgrounds often bring shared experiences and concerns, aligning individuals with certain political views or parties. This alignment can either drive or deter voting, depending on whether individuals feel represented.
Second, representation matters. Seeing candidates or officials from their own ethnic background can make voters feel more connected and represented in politics, boosting their likelihood to vote. On the other hand, a lack of representation can lead to disinterest and reduced turnout.
Finally, ethnicity affects access to voting resources. This includes information on voting, language support at polling stations, and physical access to these locations. Ethnic minorities frequently encounter barriers like voter suppression and socioeconomic challenges, which can limit their voting participation.
What Historical Events have shaped Ethnic Voter Turnout?
Historical events have significantly influenced ethnic voter turnout, often boosting political awareness and action within ethnic communities. Key examples include:
- Civil Rights Movements: The 1950s and 1960s civil rights movement in the U.S. greatly impacted African American voter turnout. The Voting Rights Act of 1965, a direct result of this movement, removed major voting barriers like literacy tests and poll taxes, leading to a marked increase in African American voter participation.
- Independence Movements: Globally, independence movements have spurred political engagement among ethnic groups. In India, the independence movement mobilized diverse populations, including various ethnic groups, fostering a strong democratic system with high voter turnout.
- Immigration Policies: Changes in immigration laws, like the U.S. Immigration and Nationality Act of 1965, have diversified electorates and altered voting patterns. This act increased immigration from Asia and Latin America, leading to greater political participation and voter turnout among these communities.
- Suffrage Movements: Expanding voting rights to disenfranchised groups, including women and ethnic minorities, has significantly boosted voter turnout. The women’s suffrage movement, for instance, not only empowered women but also encouraged political participation among various ethnic groups.
- Post-War Migration in Europe: Post-World War II migration brought new ethnic minorities into Europe’s electorate. The political engagement of these groups has evolved, reflecting their increasing influence in European politics.
These events have shaped voting rates among ethnic groups and the broader political landscape, influencing policy and representation. Understanding these historical developments is key to grasping current voting behaviors and trends in different ethnic communities.
How do Socioeconomic factors influence Ethnic Voter Turnout?
Income and education significantly influence ethnic voter turnout. Higher-income individuals often have better access to voting resources and are more informed, leading to higher turnout. Conversely, lower-income individuals, more common in some ethnic groups, face barriers like limited transportation and work constraints, reducing their likelihood of voting.
Education also plays a key role. Higher education correlates with greater political awareness and participation. Ethnic minorities with less access to quality education may feel less confident or informed about voting.
These socioeconomic factors particularly affect ethnic minorities. Issues like income inequality and educational disparities disproportionately impact these groups, influencing their voter turnout. Ethnic minorities struggling economically or educationally might feel disconnected from politics, believing their vote has little impact.
The combination of socioeconomic status and ethnicity in voter turnout has significant implications for democracy. When ethnic groups are underrepresented due to socioeconomic challenges, their interests and needs might be overlooked in political decisions.
What are some Successful Strategies to improve Ethnic Voter Turnout?
To boost ethnic voter turnout, several effective strategies are key:
- Targeted Voter Education: Educating ethnic minority communities about voting is crucial. This involves providing materials in various languages and formats, like videos and online content. The U.S. Election Assistance Commission is a good example, offering resources in multiple languages.
- Community Outreach: Collaborating with community organizations and leaders helps organize voter registration and educational events. Successful examples include partnerships with local churches and cultural centers, like the “Souls to the Polls” initiative in the African American community.
- Culturally Sensitive Messaging: Tailoring campaign messages to specific ethnic groups, considering their cultural nuances, ensures relevance and engagement. Using community-specific symbols and languages in campaign materials is effective.
- Language Accessibility: Offering voting materials and assistance in multiple languages is essential. This includes providing multilingual ballots and voter guides, a practice common in countries like Canada and the U.S.
- Empowering Community Leaders: Influential local leaders within ethnic communities are key in motivating voters and providing information. In the Hispanic community, for example, local leaders have been instrumental in voter registration and education efforts.
- Technology and Social Media: Using online platforms and social media is a powerful way to engage ethnic minority voters, particularly younger ones. Digital campaigns can effectively spread awareness and provide voting information.
- Policy Reforms: Advocating for more accessible voting policies is vital. This includes combating voter suppression, increasing polling places in minority areas, and supporting laws for easier registration and voting, like same-day registration and extended early voting.
Combining these strategies ensures a more inclusive and effective approach to increasing ethnic voter turnout, representing all population segments in the democratic process.
How can Technology impact Ethnic Voter Turnout?
Technology can greatly enhance ethnic voter turnout in several key ways:
- Online Voter Registration: This makes registering to vote easier and more accessible, especially for ethnic minorities who might face language barriers or have limited access to traditional registration methods. In the U.S., states with online registration have seen higher registration rates among ethnic minorities.
- Information Dissemination: The internet and social media are effective for spreading voting information. They can educate voters on their rights, polling locations, and procedures, with content tailored to specific ethnic groups in various languages. This approach helps bridge information gaps that often result in lower turnout among ethnic minorities.
- Targeted Digital Campaigns: Digital tools enable political campaigns to directly reach ethnic groups with relevant messages. Using data analytics, campaigns can pinpoint key issues for these communities and craft messages that motivate them to vote.
- Mobile Voting Apps: These apps can make voting more accessible for those who find it hard to visit polling stations, like people with disabilities, those without transportation, or those with tight schedules. Despite security concerns, these apps could boost turnout by simplifying the voting process.
- Social Media Engagement: Platforms like Facebook, Twitter, and Instagram are increasingly used to engage voters, especially the youth. Ethnic minorities, particularly younger people, can be reached effectively through these channels. Campaigns and civic groups use social media to mobilize voters and foster a sense of community.
- Election Monitoring and Transparency: Technologies like blockchain can be used for secure voting and real-time issue reporting, enhancing election transparency. This can build trust in the electoral process among ethnic minorities.
What ethical considerations are associated with ethnicity and voter turnout?
Ethical considerations in the context of ethnicity and voter turnout are multifaceted and crucial for maintaining a fair and inclusive democratic process. These considerations include:
- Avoiding Discrimination: It’s essential to ensure that electoral processes and campaigns do not discriminate against voters based on their ethnicity. This includes avoiding racially charged rhetoric or policies that disproportionately impact certain ethnic groups. For example, voter ID laws have been criticized for disproportionately affecting minority communities.
- Promoting Fair Representation: Ethical electoral practices should aim to provide fair representation for all ethnic groups. This involves not only ensuring that all groups have the opportunity to vote but also that they are adequately represented in the political arena. For instance, the creation of electoral districts should be free from gerrymandering that dilutes the voting power of ethnic minorities.
- Respecting Cultural Identities: Recognizing and respecting the diverse cultural identities within the electorate is vital. This respect can manifest in providing voting materials in multiple languages, ensuring that polling places are accessible and culturally sensitive, and acknowledging the different ways in which various communities engage with the political process.
- Ensuring Equitable Access: All voters should have equal access to the electoral process. This means addressing barriers such as lack of transportation, limited polling locations in minority neighborhoods, and restrictive voting hours that can disproportionately affect ethnic minorities. Efforts should be made to ensure that voting is as accessible as possible for all groups.
- Educational Outreach: Voter education is a critical ethical consideration. Educating all segments of the population about their voting rights and the electoral process, particularly in communities that have historically been marginalized, is essential for an informed electorate.
- Transparency and Accountability: Ensuring transparency in how elections are conducted and holding those in charge of the electoral process accountable is crucial. This transparency helps build trust among all ethnic groups in the fairness and integrity of the electoral process.
- Combatting Misinformation: In an age where misinformation can spread rapidly, particularly on social media, it’s ethically important to combat false information that could mislead voters or discourage turnout among certain ethnic groups.
By addressing these ethical considerations, societies can work towards more equitable and representative electoral processes that respect and reflect the diversity of their populations.
What can we learn from International Experiences with Ethnic Voter Turnout?
International experiences with ethnic voter turnout teach us valuable lessons for enhancing democratic participation. By examining practices from various countries, we can identify effective strategies and understand diverse challenges.
- Best Practices and Policies: Countries have developed unique methods to boost ethnic voter turnout. New Zealand, for example, has increased Maori participation through Maori electoral rolls and constituencies. Canada and South Korea offer election materials in multiple languages, addressing the needs of their diverse populations.
- Technology and Accessibility: Technology plays a crucial role in voting. Online voter registration, like in California, improves access for diverse communities. Social media campaigns are also effective in engaging ethnic voters, particularly younger ones.
- Cultural Sensitivity in Campaigns: Culturally sensitive campaigns are vital. In the U.S., “Voto Latino” uses bilingual resources for Hispanic voters, and “Souls to the Polls” connects voting with African American cultural and religious traditions.
- Addressing Voter Suppression: Understanding the challenges ethnic minorities face is essential. The U.S. history of voter suppression against African Americans, for instance, has prompted significant advocacy and legal efforts to protect voting rights.
- Ethnic Representation in Politics: Ethnic representation in politics is key. The U.S. saw increased voter turnout among ethnic minorities during the Obama administration, demonstrating the impact of representation.
- Community Engagement and Education: Voter education and community engagement are crucial for increasing turnout. This involves providing voting rights information and collaborating with local organizations and events.
Analyzing these international experiences helps us understand how to adapt strategies and policies to local contexts, enhancing ethnic voter turnout. This approach highlights successful initiatives and ongoing challenges, guiding countries in improving their democratic processes and ensuring fair representation for all ethnic groups.


